
I have extended the same technique (JavaScript) to display the Interactive Google Charts based on the SharePoint Data without writing any code :o). The javascript code uses JQuery and Google Interactive Charts (aka Visualization API).
You need to perform following steps:
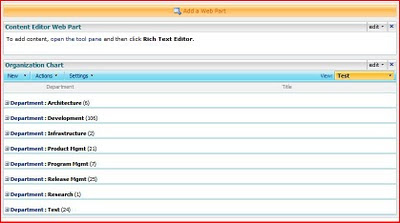
1. Create a new SharePoint List View.
2. Group the data by a Column e.g. Title.

3. Add Content Editor WebPart
4. Select Edit-> Modify Shared WebPart -> Source Editor and paste the following JavaScript:
<!--
Author: Tahir Naveed
Date: 2010-04-15
Article URL:http://mysplist.blogspot.com/2010/04/intractive-sharepoint-charts-with-no.html
Blog URL: http://mysplist.blogspot.com/
Original Code: http://www.endusersharepoint.com/2009/04/29/finally-dynamic-charting-in-wss-no-code-required-part-3-multiple-pie-charts
-->
<SCRIPT type=text/javascript>
if(typeof jQuery=="undefined")
{
    var jQPath="http://ajax.googleapis.com/ajax/libs/jquery/1.3.2/";
    document.write("<script src='",jQPath,"jquery.js' type='text/javascript'><\/script>");
}
</SCRIPT>

<script type="text/javascript" src="http://www.google.com/jsapi">
</script>

<SCRIPT type=text/javascript>
var ColValue = new Array();
var ColName = new Array();

// Getting the Data
$("document").ready(function(){
 var arrayList=$("td.ms-gb:contains(':')");
 var coord= new Array();
 var labels= new Array();
 $.each(arrayList, function(i,e)
 {
  var MyIf= $(e).text();
  var txt= MyIf.substring(MyIf.indexOf('(')+1,MyIf.length-1);
  // Extract the 'Y' coordinates
  coord[i]=txt;
  var txt1= MyIf.substring(MyIf.indexOf(':')+2,MyIf.indexOf("(")-1);
  // Extract the labels
  labels[i]=txt1+"("+txt+")";
  //add also coordinates for better read
 });
 ColValue = coord;
 ColName = labels;
 });

//Graph Rendering
google.load("visualization", "1", {packages:["columnchart"]});
google.setOnLoadCallback(drawChart);
function drawChart()
{
  var data = new google.visualization.DataTable();
  data.addColumn('string', 'Department');
  data.addColumn('number', 'Department');
  data.addRows(ColValue.length);
  for (i=0; i<ColValue.length; i++)
  {
   data.setValue(i, 0, ColName[i]);
   data.setValue(i, 1, parseInt(ColValue[i]));
  }
  var chart = new google.visualization.ColumnChart(document.getElementById('chart_div'));
  chart.draw(data, {width: 600, height: 240, is3D: true, title: 'Graph Title'});
}
</script>

<div id="chart_div" align="center"></div>
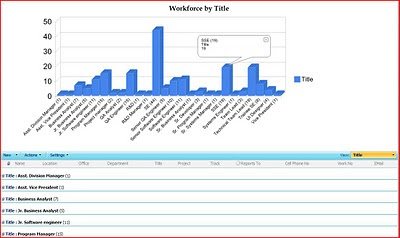
5. You will see the error message: Internet Explorer cannot display the WebPage. Ignore the message and remove the ?PageView=Shared from URL and refresh the page. You should be able to see the chart as follows:


Looks really good, Tahir. Could you give us more information on what you grouped on and what is being displayed? Also, your labels are laid out very nicely on the x and y axis. How did you do that?
ReplyDeleteMark
Also, the scale on Y-axis comes automatically, you just have to provide the values of the vertical bars.
ReplyDeleteHOW DO YOU GET IT TO SHOW MULTIPLE DEPARTEMENTS? for example if i have two departments on with 3 and one with 4, it would show them stacked with the appropriate amount and different colors?
ReplyDeleteCan I display multiple charts? if I have two list can i get two different charts by specifying which list to use?
ReplyDeleteAlso I tried your example, I have two list on my home page and when I drop your code it combines the data ffrom both list and display in one chart.
Answer 1: You have to group the list by column "Department". Javascript will get the value of the grouped column from the View. And the count of that department will be displayed as a bar. Thats how Google Chart API works (provide a title and a value and it will return the Image).
ReplyDeleteFor colors you also need to check the google chart API.
Answer 2:
ReplyDeleteNo, this code works only if there is one grouped view available. However here is a workaround:
1. Create Page1.aspx for list1, group it and display first chart.
2. Craete Page2.aspx for list2, group it and display second chart.
3. Add two Page Viewer Webparts on your home page and display Page1 and Page 2 in it.
I am sure this will work.
Another code: http://www.endusersharepoint.com/2009/04/28/finally-dynamic-charting-in-wss-no-code-required-part-2/
ReplyDeleteExcellent Work,Great article.It works for SharePoint 2010
ReplyDeleteThank you Akalanka!
ReplyDeleteI actually havent tried it on SharePoint 2010. Let me try it and will update you here.
Excellent work Tahir! Just tired for the first time after one week of experience with sharepoint & it worked-:) How would i change this code to display PIE chart and have visualation effect on mouse focus per sample on the google page below?
ReplyDeletehttp://code.google.com/apis/chart/interactive/docs/quick_start.html
Thanks Shahzad!
ReplyDeleteGive me your email and I can forward you a sample code.
[email protected]
ReplyDeleteThanks
Sent.
ReplyDeleteTahir,
ReplyDeleteGreat work ! I tried many others but this has been the simplest. Could you please provide code for mouse focus as above. Email id: [email protected]
Thanks and nice work again
-C
Hi Chris,
ReplyDeleteMouse Focus functionality is the part of Google Visualization API. Please refer to Google Visualization API at the following location:
URL: http://code.google.com/apis/chart/index.html
Thanks,
Tahir
Great work mate. Keep the good work up.
ReplyDeleteHappy Coding.
Regards,
Jaliya
Thanks Jaliya.
ReplyDeleteDo you know how to display multiple pie charts in SharePoint 2010? For MOSS 2007,I had tried the code given at http://no-code-moss2007.blogspot.com/2009/04/dynamic-charts-graphs-in-sharepoint_29.html and it worked fine but in SharePoint 2010 it doesnt work. Can you mail it to [email protected]? Thanks in advance.
ReplyDelete@Raunak: I actually never tried this in SP 2010. I will post something when I get a chance to do the experiment.
ReplyDeleteThanks a lot...
ReplyDeleteI can't get this to work. Help please
ReplyDeleteMike
hey tahir,
ReplyDeleteI am trying to use this code on a sharepoint version(I think 2003) inside a company intranet. I dont know why I am not able to see the graph. I did exactly what you instructed.
can you suggest some troubleshooting steps please?
Hey Anonymous!
ReplyDeleteThe CSS of SharePoint 2003 is different than MOSS 2007 so the code above is not gona work for SharePoint 2003. You might have to tweek a bit.
Thanks
Great work Tahir, I just did copy/paste of your code and it worked.
ReplyDeleteI tried to display multiple graphs in single page and was able to do by tweaking your script and also working on ID's of webparts which are placed on the page.
Instead of below line:
var arrayList=$("td.ms-gb:contains(':')");
I used
var arrayList=$("#WebPartWPQ5").find("td.ms-gb:contains(':')");
Where WebPartWPQ5 is ID of the webpart.
similarly i had placed another webpart and also used another div tag to display another graph.
Thanks,
Sri
Hi Srinath
Deletewould you be kind enough to share the code for this? I have been trying to get it to work for multiple graphs on my page but have been able to do so. Please help!
You could send the code to my email address [email protected]?
I'd love to see this as well! [email protected]
DeleteSrinath,
ReplyDeleteThank you for your feedback :) and for that great tweak.
Hi Tahir
ReplyDeleteWhere is the Jscript code? I am using SP2007
Sorry, some formatting got messed. Its available now.
ReplyDeleteThanks Tahir
ReplyDeleteJust so I am clear..do I need to modify any part the code before pasting it into the CEWP so that it reads my list?
No change in the code is required. Just copy/paste and it should work fine.
ReplyDeleteThanks Tahir!
ReplyDeleteIt worked perfectly and now I am the star of the office. Manyy thanks again!
Hi Tahir
ReplyDeleteHow would you modify this code to show multiple charts based on different views from the same list?
@Anonymous: You are welcome.
ReplyDelete@Debbie: Well the exact above code works for one view only. I havent tried it on multple views but here is an idea worth trying. First displa mulitple views on the page and then analyze their generated CSS and update arrayList=$(“td.ms-gb:contains(‘:’)”); for each view. I hope it helps.
This comment has been removed by the author.
ReplyDeleteHi Debbie,
ReplyDeleteThere is no simple (copy/Paste) solution for that or at least I haven't seen it so far. You have to understand with the rendered CSS on the page and modify the above Javascript code to achieve multiple views functionality.
Very simple to use .. Great work
ReplyDeleteThank you!
DeleteBest I have seen - Nevron Chart SharePoint - no code too...
ReplyDeleteHello! Thanks for adding this -- very helpful! I have a question -- we have really long column titles (ex: "No Description listed/Incorrect Description"). The font is automatically tiny and I can't figure out how to make it bigger. I've tried working with the Google API code to increase the font size on the horizontal axis without a lot of luck. It looks like it's also possible to wrap the text on longer column titles but I can't figure out how to do that either.
ReplyDeleteAny ideas?
I am not sure how to achieve this wrapping of long text in columns. You might want to post this question on Google Visualization API Forum:
DeleteURL: https://groups.google.com/forum/?fromgroups#!forum/google-visualization-api
Excellent work Tahir....
ReplyDeleteThank you so much.
Keep Posting :)
You are the best man....
ReplyDeleteI need same code to make pie chart.
Pls forward me.
[email protected]
Thanks Sukhbir! This comment box is not allowing me to post script here. Check your email.
DeleteCould you provide script for solution using pie charts, as well as solution for two charts/graphs on one page (from same list with two different groupings)? [email protected].
ReplyDelete