
In this post, I am going to explain how to display a chart from an excel file to a SharePoint Page using Excel Web Access web part.
- Create an Excel work book with the following data in it.

- Insert a graph chart by selecting the data rang
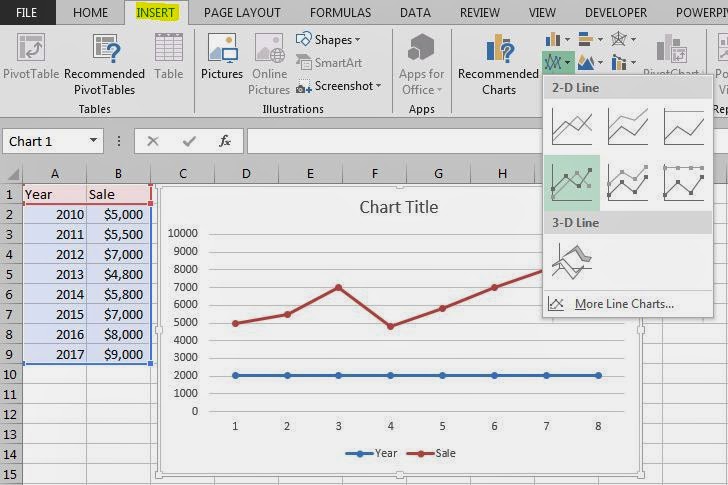
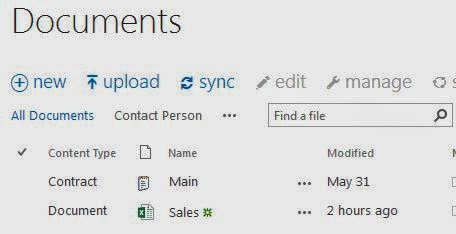
- Save the workbook (mine is called Sales.xlsx) and upload it in a document library in SharePoint.
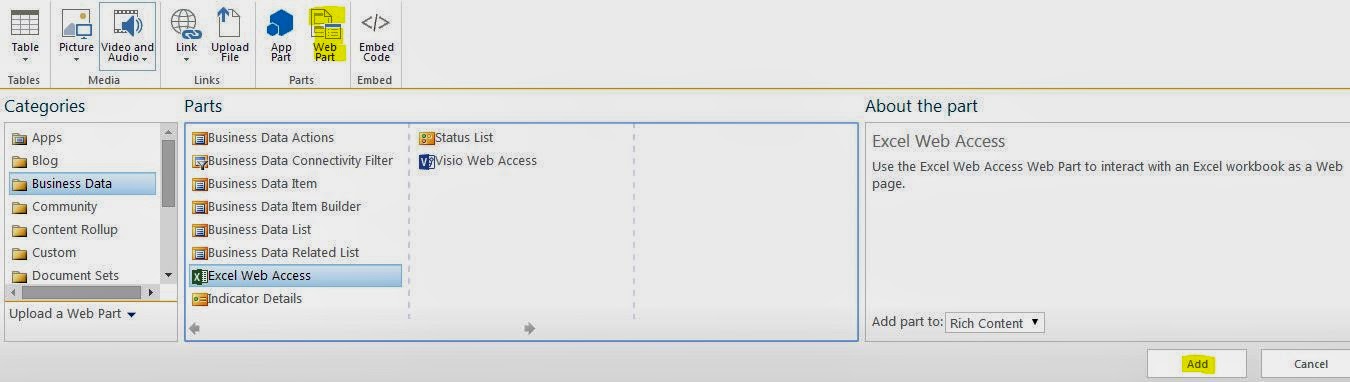
- Now edit and add an Excel Web Access web part on any page where you want to display the chart.
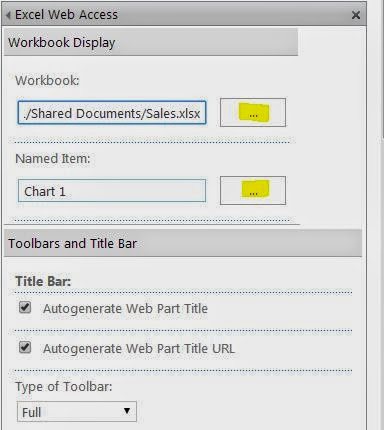
- Edit web part to see its properties

- Set Workbook (select Salex.xlsx from the document library) and Named Item properties (Chart 1) and then hit OK on the web part. By default all charts are named as Chart 1, Chart 2 etc
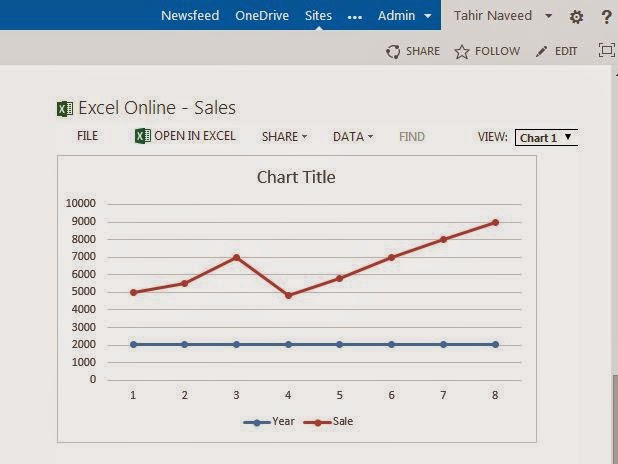
- You should be able to see the chart from the Excel workbook on the page.
Every time you have a new data in Excel workbook, just upload the file into the document library and refresh the page and you will see the updated chart.


No comments:
Post a Comment